library(mapa)4 Pathway Similarity Calculation
This chapter covers the two methods available in MAPA for calculating pathway similarity, which include traditional similarity (e.g. Jaccard, Wang algorithm) and Pathway biological text embedding similarity (Biotext embedding) we developed.
Important
Prerequisites: Before calculating pathway similarity, ensure you have completed pathway enrichment analysis using either enrich_pathway() or do_gsea() as described in Chapter 3. The enriched_pathways object used in this chapter must be the output from the previous step.
# If you haven't performed enrichment analysis yet, run:
# enriched_pathways <- enrich_pathway(...)
# or
# enriched_pathways <- do_gsea(...)

# Load your enrichment results if saved previously:
# load("path/to/your/enriched_pathways.rda")
4.1 Overview
MAPA provides two approaches for calculating pathway similarity:
- Traditional Similarity (
merge_pathways()): Uses gene/metabolite overlap and semantic similarity - Biotext Embedding Similarity (
get_bioembedsim()): Uses LLM text embeddings to capture semantic relationships
Both methods prepare your data for downstream clustering analysis, so you can choose the approach that best fits your research needs and computational resources.
4.2 Method Comparison
| Aspect | Traditional Similarity | Biotext Embedding Similarity |
|---|---|---|
| Basis | Gene/metabolite overlap + semantic structure | Text semantic meaning |
| Speed | Fast, deterministic | Slower, requires API calls |
| Cost | Free | API usage costs |
| Reproducibility | Fully reproducible | Highly reproducible (minor API variations) |
| Novel discoveries | Based on known annotations | Can identify functional relationships beyond overlap |
| Internet dependency | Minimal (for GO/KEGG updates) | Required for API access |
| Cross-database integration | Limited by annotation overlap | Excellent semantic integration |
When to use each method:
- Traditional Similarity: When working with limited internet access, need fully reproducible results, or working with well-annotated pathways where overlap is meaningful
- Biotext Embedding (recommended): When exploring novel functional relationships, integrating diverse databases, or when semantic understanding is more important than annotation overlap
4.3 Method 1: Traditional Similarity
The merge_pathways() function calculates similarity using established methods:
- Only GO terms: Semantic similarity using the simona package
- GO/KEGG/Reactome/SMPDB pathways: Gene/metabolite overlap similarity (Jaccard, Dice, Overlap, and Kappa)
gene_similarity_result <-
  merge_pathways(
    object = gene_enriched_pathways,
    database = c("go", "kegg", "reactome"),
    # Statistical cutoffs (only pathways passing these cutoffs are used for similarity calculation)
    p.adjust.cutoff.go = 0.05,
    p.adjust.cutoff.kegg = 0.05,
    p.adjust.cutoff.reactome = 0.05,
    count.cutoff.go = 5,
    count.cutoff.kegg = 5,
    count.cutoff.reactome = 5,
    # Similarity methods
    measure.method.go = "Sim_XGraSM_2013",  # GO semantic similarity
    go.orgdb = "org.Mm.eg.db",               # Required for GO analysis
    measure.method.kegg = "jaccard",        # Gene overlap similarity
    measure.method.reactome = "jaccard"     # Gene overlap similarity
  )

# --------------------
# GO database...
# Calculating similartiy matrix, it may take a while...
# relations: is_a, part_of, regulates, negatively_regulates, positively_regulates
# IC_method: IC_annotation
# term_sim_method: Sim_XGraSM_2013
# IC_method: IC_annotation
# Completed GO term (BP) similarity calculation.
# relations: is_a, part_of, regulates, negatively_regulates, positively_regulates
# IC_method: IC_annotation
# term_sim_method: Sim_XGraSM_2013
# IC_method: IC_annotation
# Completed GO term (MF) similarity calculation.
# relations: is_a, part_of, regulates, negatively_regulates, positively_regulates
# IC_method: IC_annotation
# term_sim_method: Sim_XGraSM_2013
# IC_method: IC_annotation
# Completed GO term (CC) similarity calculation.
# Completed GO term similarity calculation successfully!
# Identifying modules...
# Done
# --------------------
# KEGG database...
# Calculating similartiy matrix, it may take a while...
# Reading KEGG annotation online: "https://rest.kegg.jp/link/mmu/pathway"...
# Reading KEGG annotation online: "https://rest.kegg.jp/list/pathway/mmu"...
# Completed KEGG pathway similarity calculation successfully!
# Identifying modules...
# Done
# --------------------
# Reactome database...
# Calculating similartiy matrix, it may take a while...
# Completed Reactome pathway similarity calculation successfully!
# Identifying modules...
# Done
# Done
Note
go.orgdb Selection:
- For model organisms with Bioconductor annotation packages: use the package directly (e.g.,
go.orgdb = "org.Mm.eg.db") - For non-model organisms: use the OrgDb object from Section 2.2.1 (e.g.,
go.orgdb = variable_info$orgdb)
Important
Organism Limitation: Traditional similarity for metabolites is recommended primarily for human studies where you can use both KEGG and HMDB databases. For non-human organisms, only KEGG is available, making this approach less informative. Consider using biotext embedding similarity instead for non-human metabolite studies.
met_similarity_result <-
  merge_pathways(
    object = met_enriched_pathways,
    database = c("hmdb", "metkegg"),
    # Statistical cutoffs (only pathways passing these cutoffs are used for similarity calculation)
    p.adjust.cutoff.hmdb = 0.05,
    p.adjust.cutoff.metkegg = 0.05,
    count.cutoff.hmdb = 5,
    count.cutoff.metkegg = 5,
    # Similarity methods
    measure.method.hmdb = "jaccard",
    measure.method.metkegg = "jaccard"
  )

# --------------------
# HMDB database...
# Calculating similartiy matrix, it may take a while...
# Completed SMPDB pathway similarity calculation successfully!
# Identifying modules...
# Done
# --------------------
# KEGG database...
# Calculating similartiy matrix, it may take a while...
# Completed KEGG pathway similarity calculation successfully!
# Identifying modules...
# Done
# Done
4.3.1 Similarity Methods Details
GO Semantic Similarity Methods
For GO terms, MAPA uses the simona package:
| Method | Type | Description |
|---|---|---|
Sim_XGraSM_2013 |
Hybrid | Combines multiple similarity aspects |
Sim_Wang_2007 |
Structure-based | Based on GO graph structure |
Sim_Lin_1998 |
Information content-based | Uses information content of terms |
Sim_Resnik_1999 |
Information content-based | Information content of most informative common ancestor |
Gene/Metabolite Overlap Similarity
For KEGG, Reactome, and metabolite pathways:
| Method | Formula | Description | Use Case |
|---|---|---|---|
jaccard |
|A ∩ B| / |A ∪ B| | Jaccard index | Default, most commonly used |
dice |
2 × |A ∩ B| / (|A| + |B|) | Dice coefficient | Emphasizes shared elements |
overlap |
|A ∩ B| / min(|A|, |B|) | Overlap coefficient | Good for pathways of different sizes |
kappa |
(Po - Pe) / (1 - Pe) | Cohen’s kappa | Accounts for chance agreement |
Tip
For detailed explanations of the similarity methods, see the simona documentation.
4.4 Method 2: Biotext Embedding Similarity
The get_bioembedsim() function leverages large language model text embedding models to capture semantic relationships between pathway descriptions, enabling more nuanced similarity calculation based on biological function.
gene_biotext_similarity <-
  get_bioembedsim(
    object = gene_enriched_pathways,
    api_provider = "openai",
    text_embedding_model = "text-embedding-3-small",
    api_key = "your_openai_api_key",
    database = c("go", "kegg", "reactome"),
    # Statistical cutoffs (only pathways passing these cutoffs are used for similarity calculation)
    p.adjust.cutoff.go = 0.05,
    p.adjust.cutoff.kegg = 0.05,
    p.adjust.cutoff.reactome = 0.05,
    count.cutoff.go = 5,
    count.cutoff.kegg = 5,
    count.cutoff.reactome = 5
  )

# Getting pathway text embeddings ...
# Calculating cosine similairty ...
# Biotext embedding and similarity calculation finished
met_biotext_similarity <-
get_bioembedsim(
object = met_enriched_pathways,
api_provider = "openai",
text_embedding_model = "text-embedding-3-small",
api_key = "your_openai_api_key",
database = c("hmdb", "metkegg"),
# Statistical cutoffs (only pathways passing these cutoffs are used for similarity calculation)
p.adjust.cutoff.hmdb = 0.05,
p.adjust.cutoff.metkegg = 0.05,
count.cutoff.hmdb = 5,
count.cutoff.metkegg = 5
)
# Getting pathway text embeddings ...
# Calculating cosine similairty ...
# Biotext embedding and similarity calculation finished
Tip
API Key Setup:
- For OpenAI: Obtain your API key from OpenAI Platform
- For Gemini: Get your API key from Google AI Studio
- For SiliconFlow: Get your API key from SiliconFlow Quick Start
Store your API key securely and never commit it to version control.
4.4.1 How Biotext Embedding Works
The biotext embedding process involves several steps:
- Text Extraction: For each pathway, the function extracts pathway name and description from respective databases
- Text Embedding: The text information is sent to the specified embedding model to generate high-dimensional vector representations
- Similarity Calculation: Cosine similarity is calculated between all pathway embedding vectors
Tip
Understanding Text Embeddings: Text embeddings convert text into numerical vectors that capture semantic meaning. For a comprehensive introduction to embeddings, including how they work, model details and best practices, see the OpenAI Embeddings Guide.
4.5 Results Interpretation
Both approaches prepare your data for the next steps: optimal cluster parameter determination and functional module identification.
# Traditional similarity results
gene_similarity_result
# Return intra-database modules generated based on pathway similarity
head(gene_similarity_result@merged_pathway_go$module_result)
Key result columns:
- module: Module identifier (e.g., “go_Module_2”)
- module_annotation: Representative annotation (pathway name with the lowest adjusted p-value for ORA/ pathway name with the highest |NES| for GSEA) for the module
- Description: Names of all the pathways in the module separated by
; - module_content: All pathways/terms (i.e. nodes) grouped in this module
- Count: Number of genes/metabolites from the input genes/metabolites list in the module
- p_adjust: Best (lowest) adjusted p-value among pathways in the module
# Biotext embedding results
gene_biotext_similarity
# Returns list with similarity matrix and enriched pathway object
names(gene_biotext_similarity)
# [1] "sim_matrix" "enriched_pathway"
# Examine similarity matrix
gene_biotext_similarity$sim_matrix[1:5, 1:5]
# GO:0016049 GO:0031589 GO:1900046 GO:0071375 GO:0061900
# GO:0016049 1.0000000 0.3779020 0.2286780 0.3376592 0.4369859
# GO:0031589 0.3779020 1.0000000 0.2702301 0.3123477 0.3938414
# GO:1900046 0.2286780 0.2702301 1.0000000 0.3277389 0.2867548
# GO:0071375 0.3376592 0.3123477 0.3277389 1.0000000 0.4493753
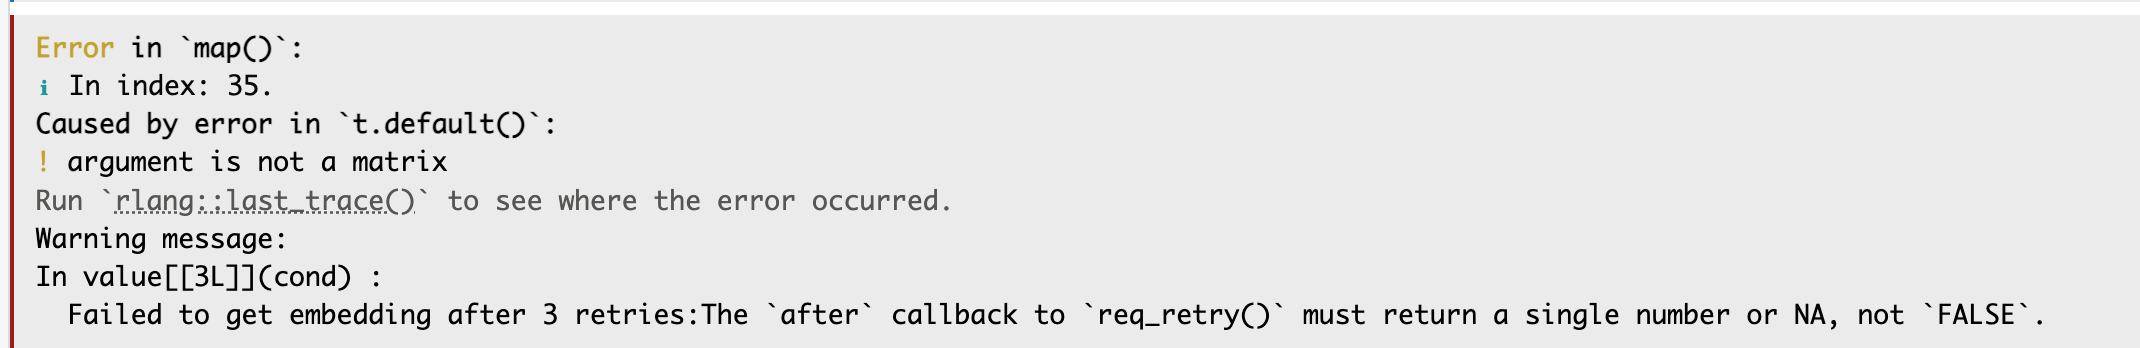
# GO:0061900 0.4369859 0.3938414 0.2867548 0.4493753 1.00000004.6 Trouble Shooting
- When calculating the pathway similarity using Biotext pathway embedding, if you encounter an error like this, it might be due to a network issue. Please try running it multiple times.
4.7 Next Steps
Continue to Optimal Clustering Parameters to determine the best clustering parameters for your similarity data, then proceed to Functional Module Identification to group related pathways into modules.