15 Functional Module Annotation
This chapter describes how to interpret the functional modules by integrating Large Language Models (LLMs) with a Retrieval-Augmented Generation (RAG) strategy. The Shiny app provides an approach to combine pathway information, scientific literature, and advanced text analysis to generate meaningful names and summaries for your functional modules.
Prerequisites: Before running LLM interpretation, ensure you have completed functional module generation as described in previous chapters. The enriched_functional_modules object used in this chapter should be the output from the module clustering step.
15.1 Overview
The LLM interpretation process integrates multiple information sources to provide comprehensive module annotations:
Information Sources:
- Pathway descriptions from GO, KEGG, Reactome, and metabolite databases
- Gene/metabolite names from your input data
- Scientific literature retrieved from PubMed based on pathway and molecule relevance
- Local documents (optional) - your own research papers or relevant literature
Analysis Pipeline:
- Information Extraction: Extracts pathway descriptions and molecule information
- Literature Retrieval: Searches PubMed for relevant scientific papers
- RAG Strategy: Uses embeddings to find and rank the most relevant literature, see Section 15.2
- LLM Generation: Generates biological module names and research summaries
This approach leverages both structured biological knowledge and cutting-edge research to provide contextually rich interpretations of your functional modules.
15.2 Understanding the RAG Strategy
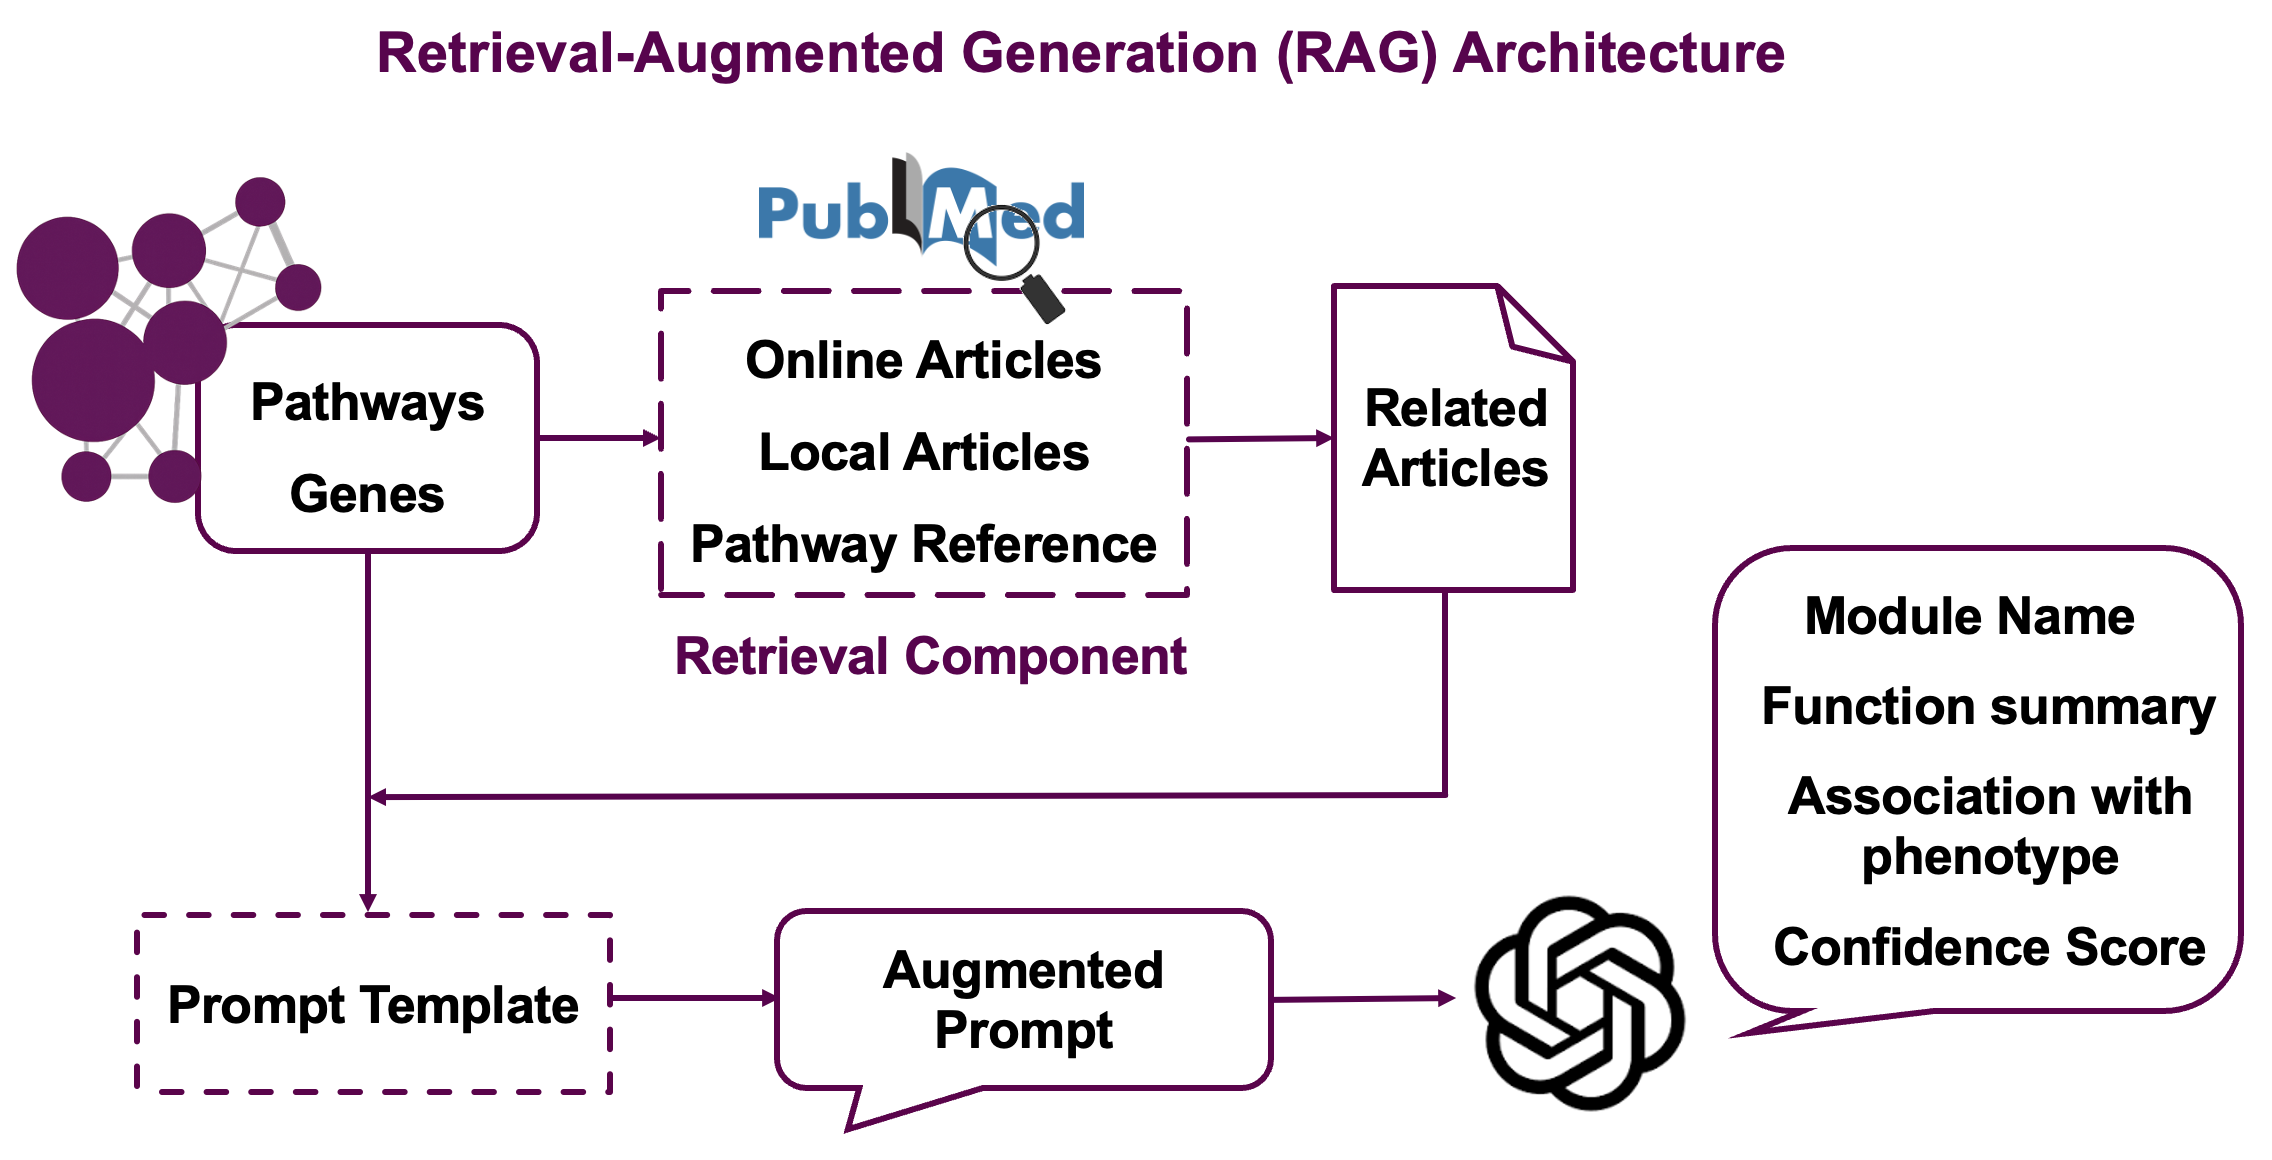
The Retrieval-Augmented Generation (RAG) strategy works in several stages:
Stage 1: Literature Search
- Searches PubMed using pathway names and gene/metabolite information
- Retrieves abstracts and titles for relevant papers
- Includes reference papers cited in pathway databases
Stage 2: Embedding-based Similarity
- Generates text embeddings for module descriptions (pathways + molecules)
- Calculates similarity between module embeddings and paper abstracts
- Filters top papers based on cosine similarity scores
Stage 3: GPT-powered Reranking
- Uses LLM to assess relevance of each paper to the specific module by assigning relevance scores (0-1) where 1 indicates high relevance to module pathways and molecules
- Select the most informative literature for final interpretation
Stage 4: Final Generation
- Combines module information with top-ranked papers
- Generates biologically meaningful module names
- Produces research summaries highlighting current knowledge
- Assigns confidence scores (0-1) reflecting the LLM’s assessment of interpretation quality based on available evidence. High confidence means strong literature support and clear biological coherence
This multi-stage approach ensures that generated annotations are both scientifically accurate and contextually relevant.
15.3 Step 1: Load Your Data
Upload previously saved results:
- Click “Browse” at the top of the left panel “Upload functional module (.rda)” to upload your analyzed functional module file (.rda format)
- Select your file
You can also proceed directly if the functional module result is already present in the current session.
15.4 Step 2: Configure LLM and API Settings
15.4.1 LLM Model Settings
Configure your LLM and text embedding models settings with references to the table below:
| Parameter | Description | Example | Notes |
|---|---|---|---|
API provider |
LLM model for text generation | "gpt-4o-mini-2024-07-18" |
Currently supports OpenAI models only |
Embedding model |
Model for text embeddings | "text-embedding-3-small" |
Used for document similarity |
API key |
OpenAI/Google/SiliconFlow API key | Required | Store securely, never commit to version control |
Model Selection: The model dropdown in the web only lists variants we’ve tested to work stably. See provider docs if you need others.
If you are a server MAPA user, please note:
When running the biotext embedding step in Chapter 13 or the module annotation step in this chapter, only models and API keys provided by SiliconFlow are supported.
This restriction exists because the server is set up in China Mainland. To ensure a stable connection to SiliconFlow:
- Users in China Mainland: Use an API key from the Chinese portal — https://siliconflow.cn
- International users: Use an API key from the global portal — https://www.siliconflow.com
15.4.2 Literature Search Settings
| Parameter | Description | Default | Use Case |
|---|---|---|---|
Module size cutoff |
Minimum pathways per module | 1 | Filter small modules to focus on substantial ones |
Years to search |
Years to search back in PubMed | 5 | Balance between recent findings and comprehensive coverage |
API Usage & Processing Time: Each module requires multiple API calls (embedding + LLM generation), with costs scaling by number of modules and literature volume, so consider tweaking Module size cutoff to focus on important modules. Typical processing takes 2-5 minutes per module, with time increasing for more literature and larger modules.
If you are using the server-based web version of MAPA, it is highly suggested that you open the browser window as the this step is running, otherwise the server may terminate the job.
15.4.3 Optional Enhancements
| Parameter | Description | Default | Benefits |
|---|---|---|---|
Disease or phenotype |
Disease/condition context | NULL |
Adds disease-specific interpretation |
Local corpus directory |
Local directory with your own PDF files | NULL |
Incorporates your own research or relevant literature to enhance the interpretation |
15.4.4 Required Parameters
Two parameters are required before submit to LLM interpretation:
Embeddings output directory (only in MAPA Shiny): The analyzed results will be displayed here
Organism gene annotation database: Select the organism of your omic data. You can refer to Data Input Chapter for detailed instruction.
Double Check: Please DO NOT select a directory that contains any of your files, as this step will erase everything inside the chosen directory. Make sure the output directory you select is completely empty.
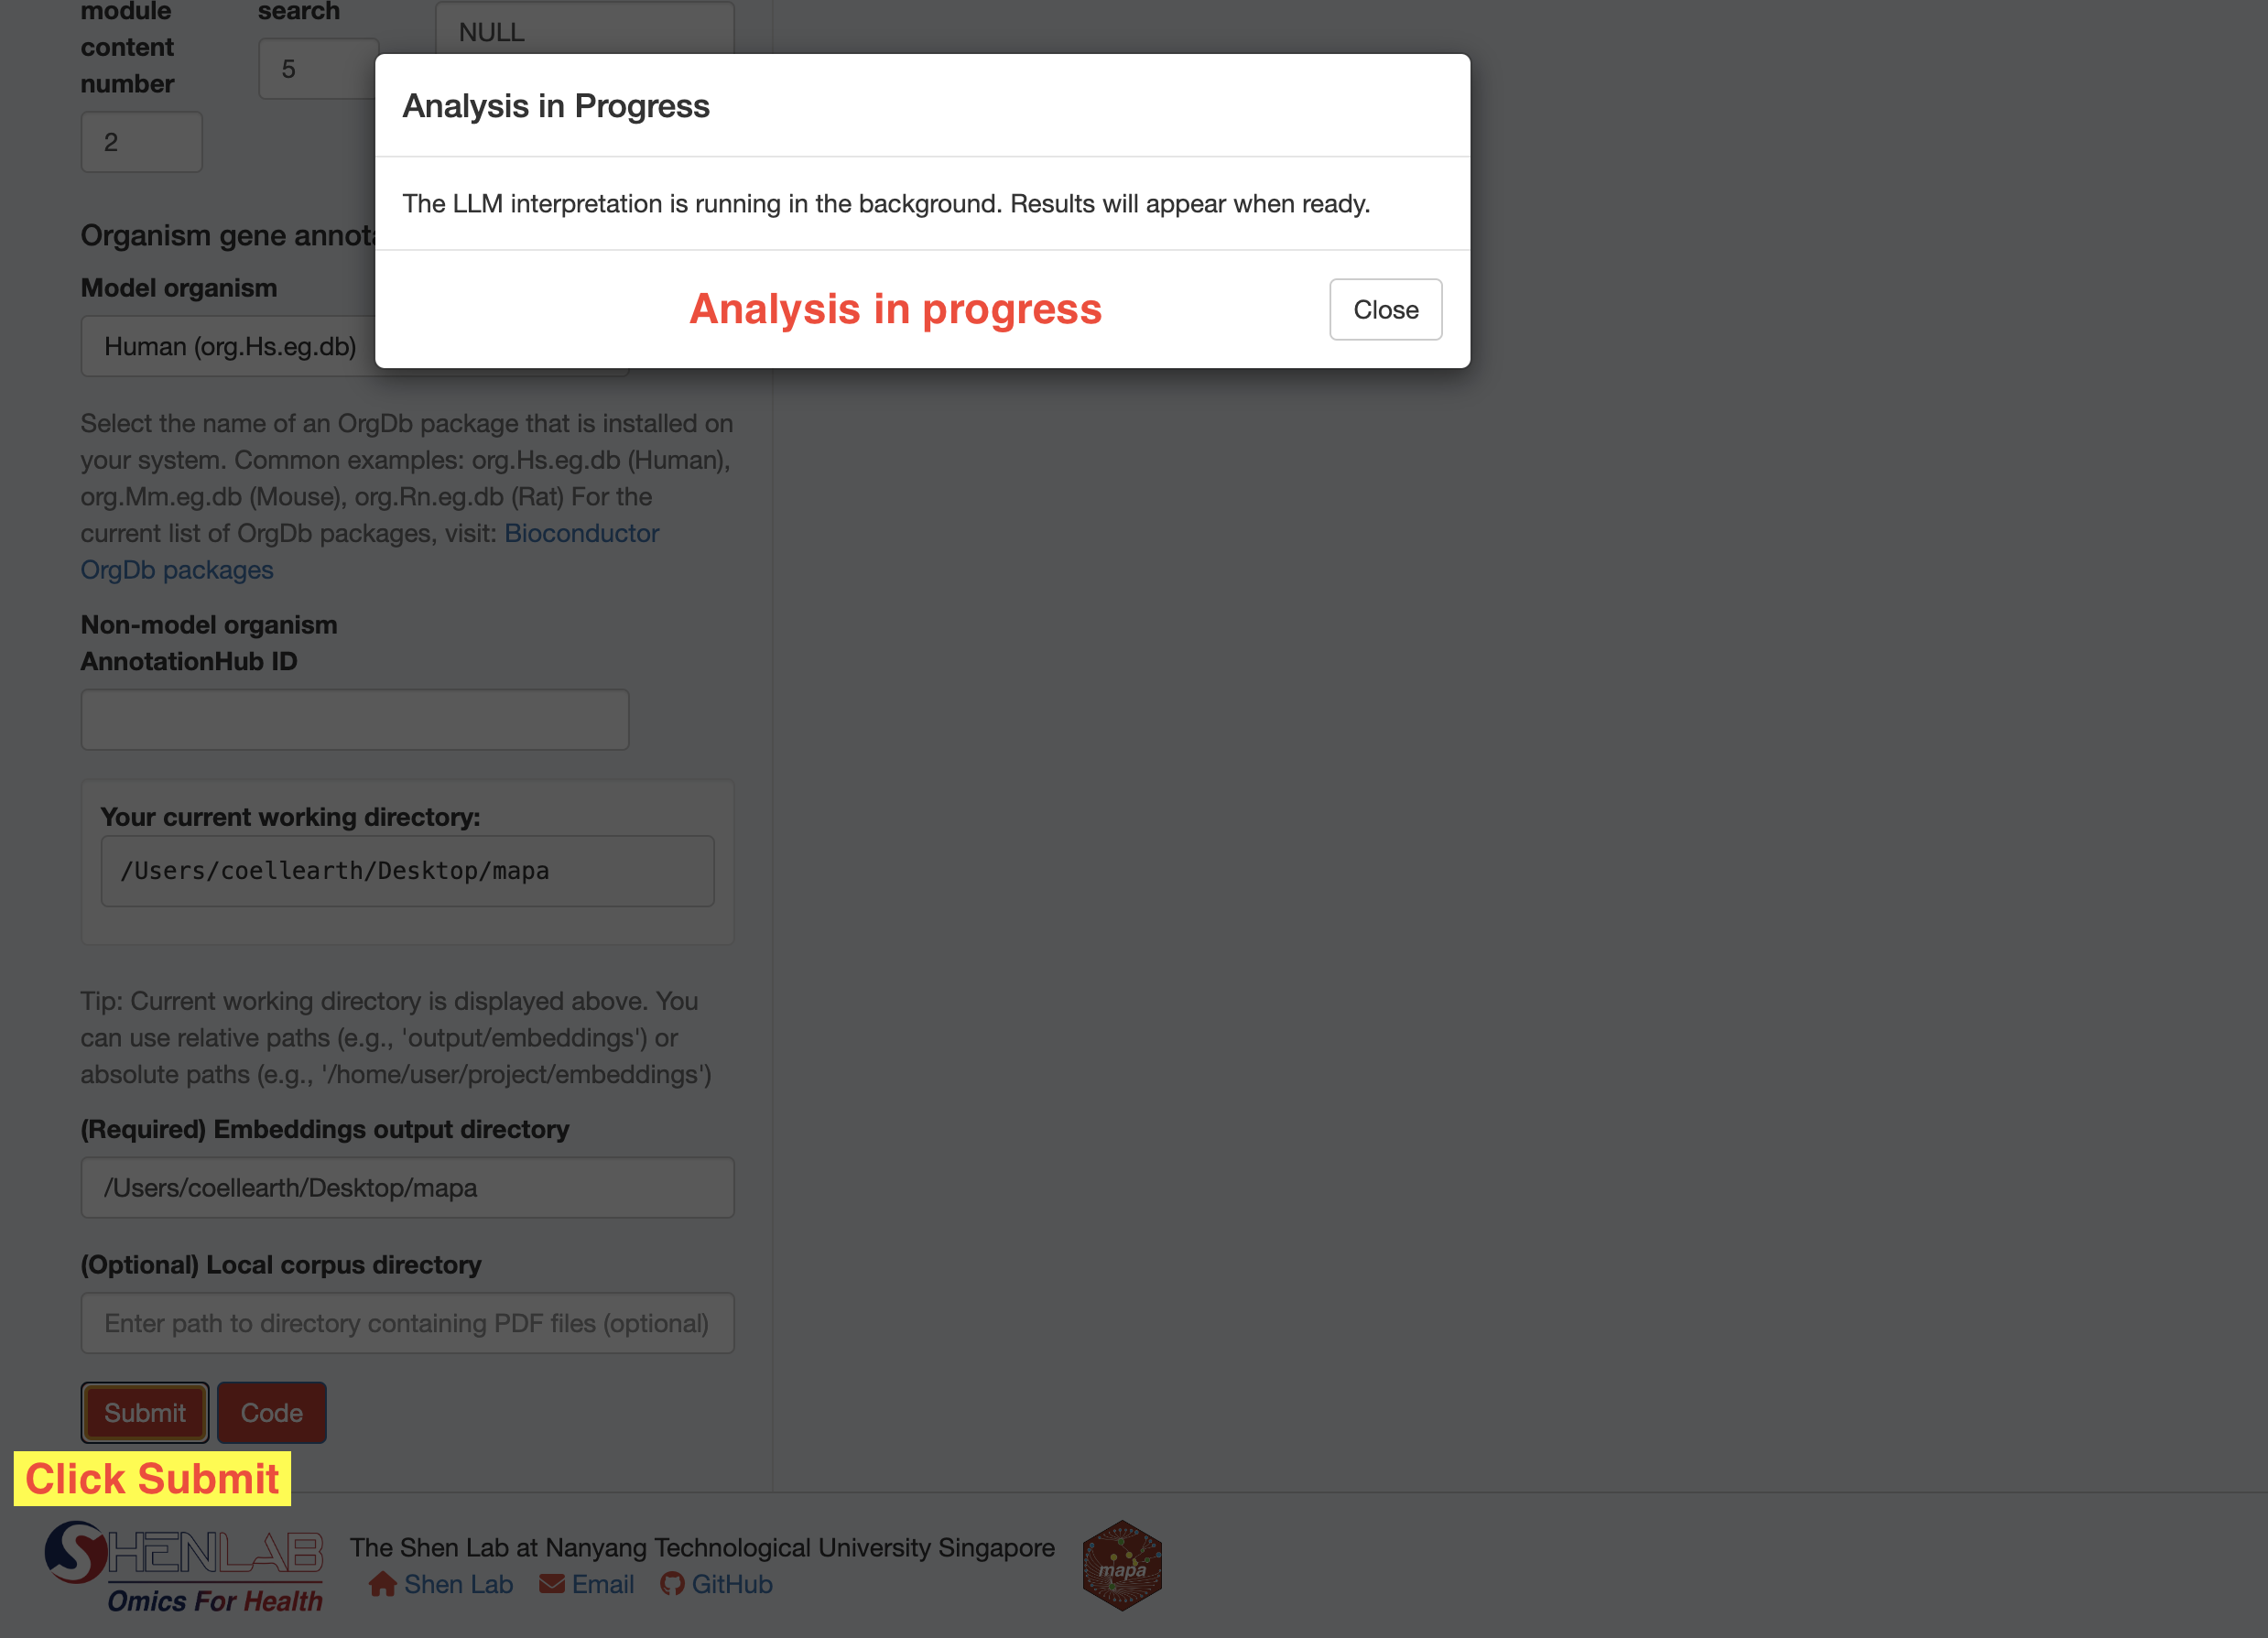
15.5 Step 3: Run the Analysis
- Verify your data is loaded - either from the current session or uploaded file
- Review all parameter selections to ensure they match your analysis goals
- Click the “Submit” button to start the LLM interpretation progress
- Monitor progress - a progress indicator will show the analysis is running
- Wait for completion - processing time usually takes more than 10 minutes, wait patiently
15.6 Step 4: Review Results
After successful completion, results will appear in the right panel with updated functional module. You can also first download the R object and load it into your R session to explore the results using Step2: Check Module Annotation Result in the lower panel.

Key result elements:
- llm_module_name: AI-generated biological module name
- module_annotation: Original representative annotation (fallback if LLM interpretation unavailable)
For each interpreted module, the results include:
- Module Name: AI-generated biological module name
- Module Summary: Original representative annotation (fallback if LLM interpretation unavailable)
- Association With Phenotype: How this module is associated with given phenotype. Empty if no disease or phenotype is entered
- Confidence Score: Indicate LLM’s assessment of interpretation quality based on available evidence. High confidence means strong literature support and clear biological coherence

Contains the exact prompt sent to the LLM for transparency. Useful for understanding AI reasoning.

The functional module results are automatically enhanced with an additional column, llm_module_name, which contains the names generated by the LLM. You can download the complete R object for future reference in the Step 2: Check Module Annotation Result panel.
15.7 Step 5: Download the Results
After completing the LLM Interpretation step, you have two options for accessing/downloading the results other than viewing it on Shiny app:
- Download the R object (.rda) containing the LLM interpretation results, which can be used for follow-up visualizations described in Chapter 16: Visualization.
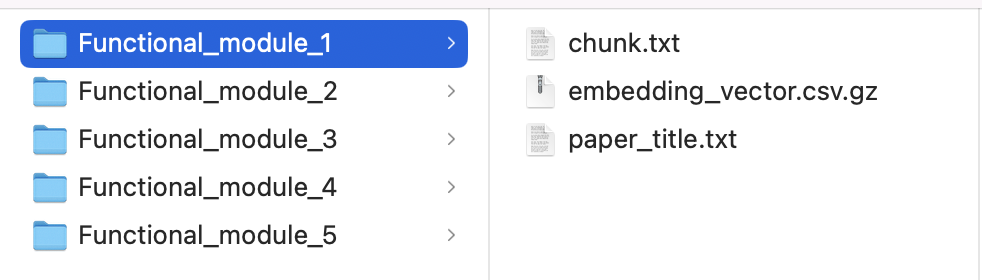
- Check out the embeddings output directory, which already includes the following for each functional module:
chunk.txt: AI-generated summaries of the retrieved PubMed literatureembedding_vector.csv.gz: Text embeddings of the literature with cosine similarity values
paper_title.txt: A list of PubMed articles identified for this functional module, including their titles and PubMed IDs
15.8 Step 6: View Analysis Code
Click the “Code” button to see the exact R code that replicates your analysis:
- Code 1: Shows
function()function usage - Code 2: Shows
function()function usage
This code can be copied and used in your own R scripts for reproducible analysis.
15.9 Best Practices
- Start Small: Begin with a subset of modules to estimate costs and processing time
- Optimize Parameters: Adjust filtering parameters based on your module complexity
- Use Phenotype Context: Specify relevant diseases/conditions for more targeted interpretations
- Include Local Literature: Add your own papers for domain-specific insights
- Review Results: Examine confidence scores and retrieved literature quality
- Iterate: Refine parameters based on initial results
15.10 Next Steps
Continue to Data Visualization to create informative plots showcasing your LLM-interpreted modules.