17 Result Report
mapashiny offers a one-click feature to export and report your functional module analysis results through comprehensive report generation. These tools enable you to share findings as structured data files and professionally formatted reports.
Prerequisites: Before generating reports, ensure you have completed your MAPA analysis workflow including:
- Enrichment analysis: Described in Chapter 12
- Pathway similarity calculation: Described in Chapter 13
- Optional: Optimal clustering parameters determination described in Chapter 14
- Clustering: Described in Chapter 14
- Optional: LLM interpretation in Chapter 15
The functions in this chapter work with the final functional_module object from your analysis.
17.1 Overview
With a single click, you can generate comprehensive analysis report in a HTML file with various plots and tables.
17.2 Step 1: Load Your Data
Option 1: Continue from Previous Step
If you have completed datavisualization in the current session, your data will automatically be available for final report.
Option 2: Upload Existing Results
You can also upload previously saved results:
- Click “Browse” at the top of the left panel (of Data Visualization function page) “Upload functional module (.rda)” to upload your functional module file (.rda format)
- Select your file
- Wait for validation - the app will automatically detect the input type and prepare for final report.
- Switch back to Results & Report page
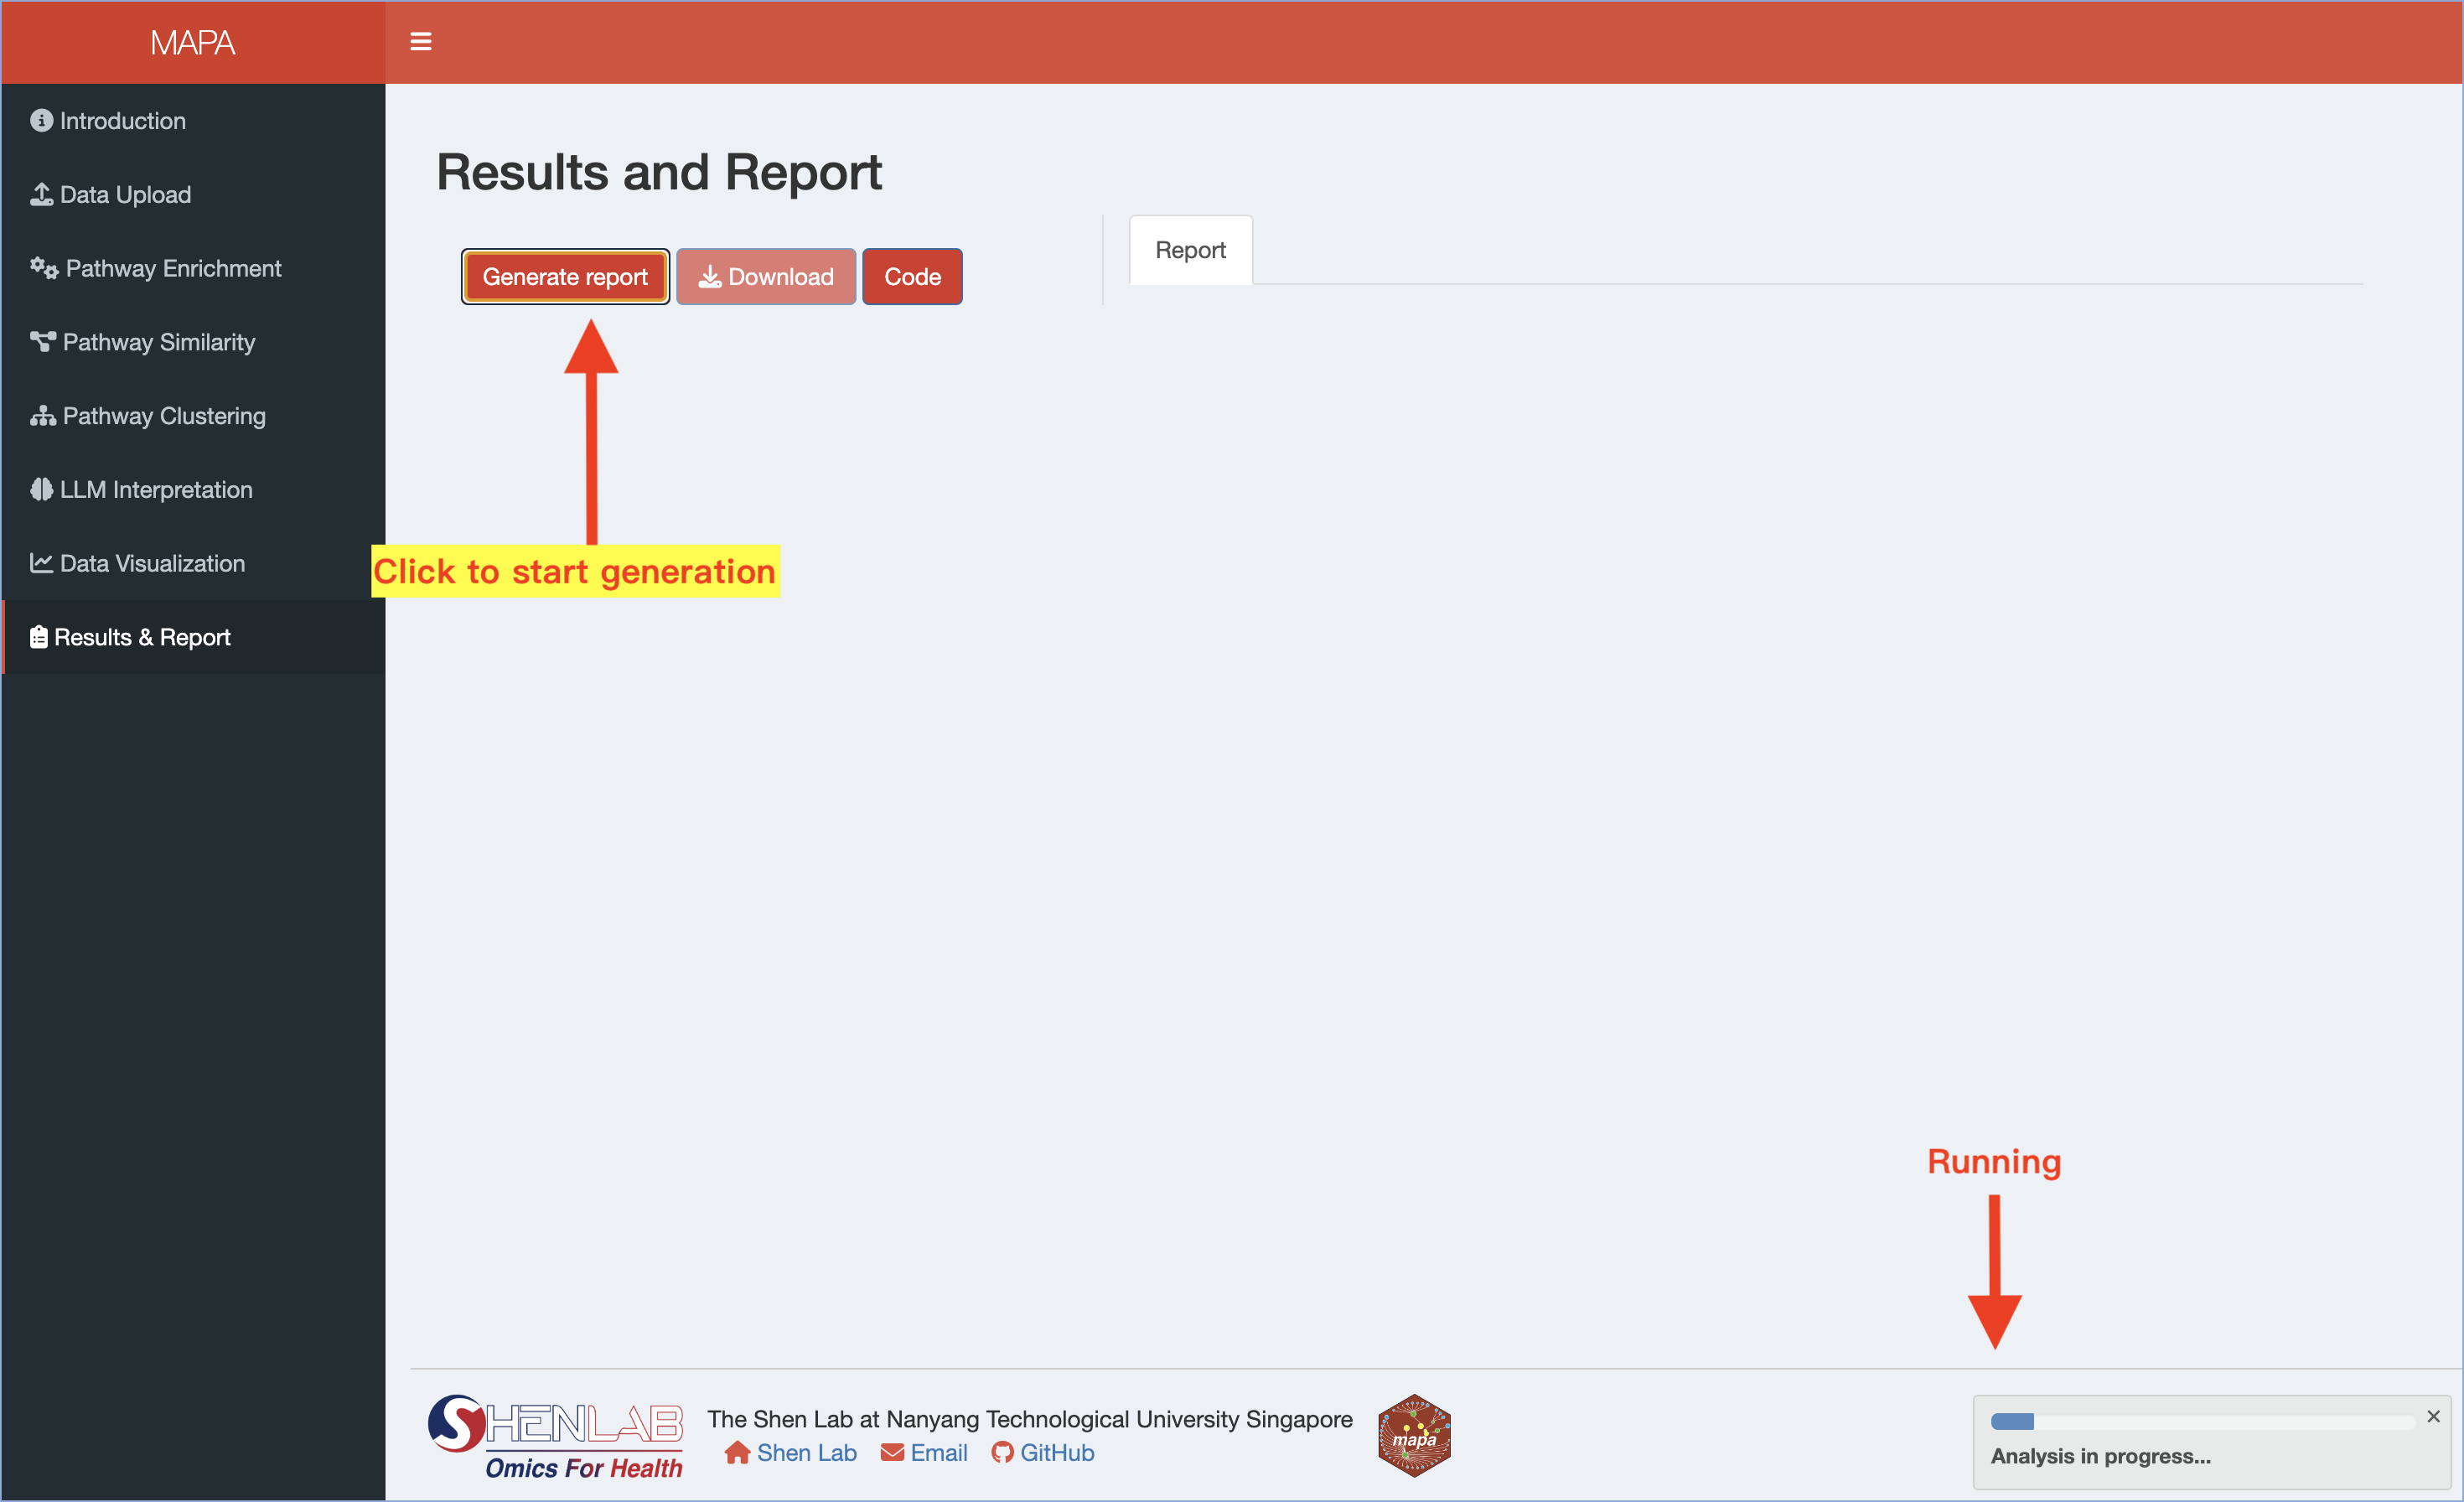
17.3 Step 2: Start Report Generation
With just one simple click, you report will be generated. This process is expected to take around 30 seconds.
17.4 Step 3: Review the Report
The generated report automatically includes:
Analysis Summary:
Parameters: Overview of enrichment analysis parameters and resultsObject information: Summary statistics for each database and analysis level, and processing timeline and method details
Visualizations:
- Top enriched pathways bar charts
- Database-specific module bar charts (if applicable)
- Functional module bar charts with LLM names (if available)
- Similarity networks for all analysis levels
Data Tables:
- One of Enrichment results for functional modules or LLM interpretation results with confidence scores (if available)
17.5 Step 4: Download the Report
You can also click Download to save the exact report shown in the right panel as an HTML file on your computer. The download will be a ZIP file—simply unzip it to access the HTML report and view its contents.
Working with Downloaded HTML file: The easiest way to save images embedded in the HTML file is to right-click on the image and select “Save image as…” (in Mac) to download it to your local device.
17.6 Step 5: View Analysis Code
Click the “Code” button to see the exact R code that replicates your analysis:
- Code 1: Shows
function()function usage - Code 2: Shows
function()function usage
This code can be copied and used in your own R scripts for reproducible analysis.
17.7 Next Steps
With your results exported and reports generated, you now have comprehensive documentation of your functional module analysis. These outputs provide the foundation for:
- Collaboration: Share HTML reports with colleagues for easy viewing and discussion
- Publication: Use HTML reports and exported the figures for manuscript preparation
- Presentation: Extract visualizations and key findings for presentations
17.8 Thank You & Reach Out
To this point, mapa shiny app workflow is now complete! Thank you for your use.
If you have any questions regarding mapa shiny app workflow, feel free to reach out via the mapashiny GitHub Issues page.
Cite Our Work: If you used mapa in your publications, we would appreciate it if you could cite our paper.
Ge, Y. et al. (2025) ‘Leveraging Large Language Models for Redundancy-Aware Pathway Analysis and Deep Biological Interpretation’. bioRxiv, p. 2025.08.23.671949. Available at: https://doi.org/10.1101/2025.08.23.671949.